Week 1 Reflection
1. Technological Determinism
It is believed that technology develops independently of social, political and economic environments and will influence these environments.
2. SCOT, Social Construction of Technology
It is a refutation of Technological Determinism. Emphasizes that the invention, development and application of technology are strongly influenced by social forces.
3. Social Shaping of Technology
Combining the two viewpoints, technology and society are in a mutually shaping and co-determining relationship. Technology does not exist independently but is part of the social structure.
4. Critical thinking about digital media
Worldview and political perspective Historical and cultural aspects Have an impact on life rather than dominating life.
Week 2 Reflection
1. Pick a website that you visit regularly. What makes it easy to use? What could be improved for increased usability and attractiveness?
The website I frequently visit is Baidu. I think it needs to filter out unnecessary content and block advertisements in terms of usability.
2. Are any parts of HTML or CSS confusing you? Where – or to whom – might you go for additional information and support?
In terms of CSS, I am not very proficient in the code design for visual effects. I will do more studying on the Codecademy website in the future.
Week 3 Reflection
1. What did you learn from conducting a web scrape?
I have learned the basic operations of web scraping, data selection, data organization, and data identification.
2. What are the challenges of using web scraping as a method for collecting data?
Legal issues, data quality issues, technical issues and ethical issues.
3. Did you encounter any ethical challenges?
I haven't encountered it yet, but I know that some things will involve issues related to user privacy and the impact on the network server.
Data Image:
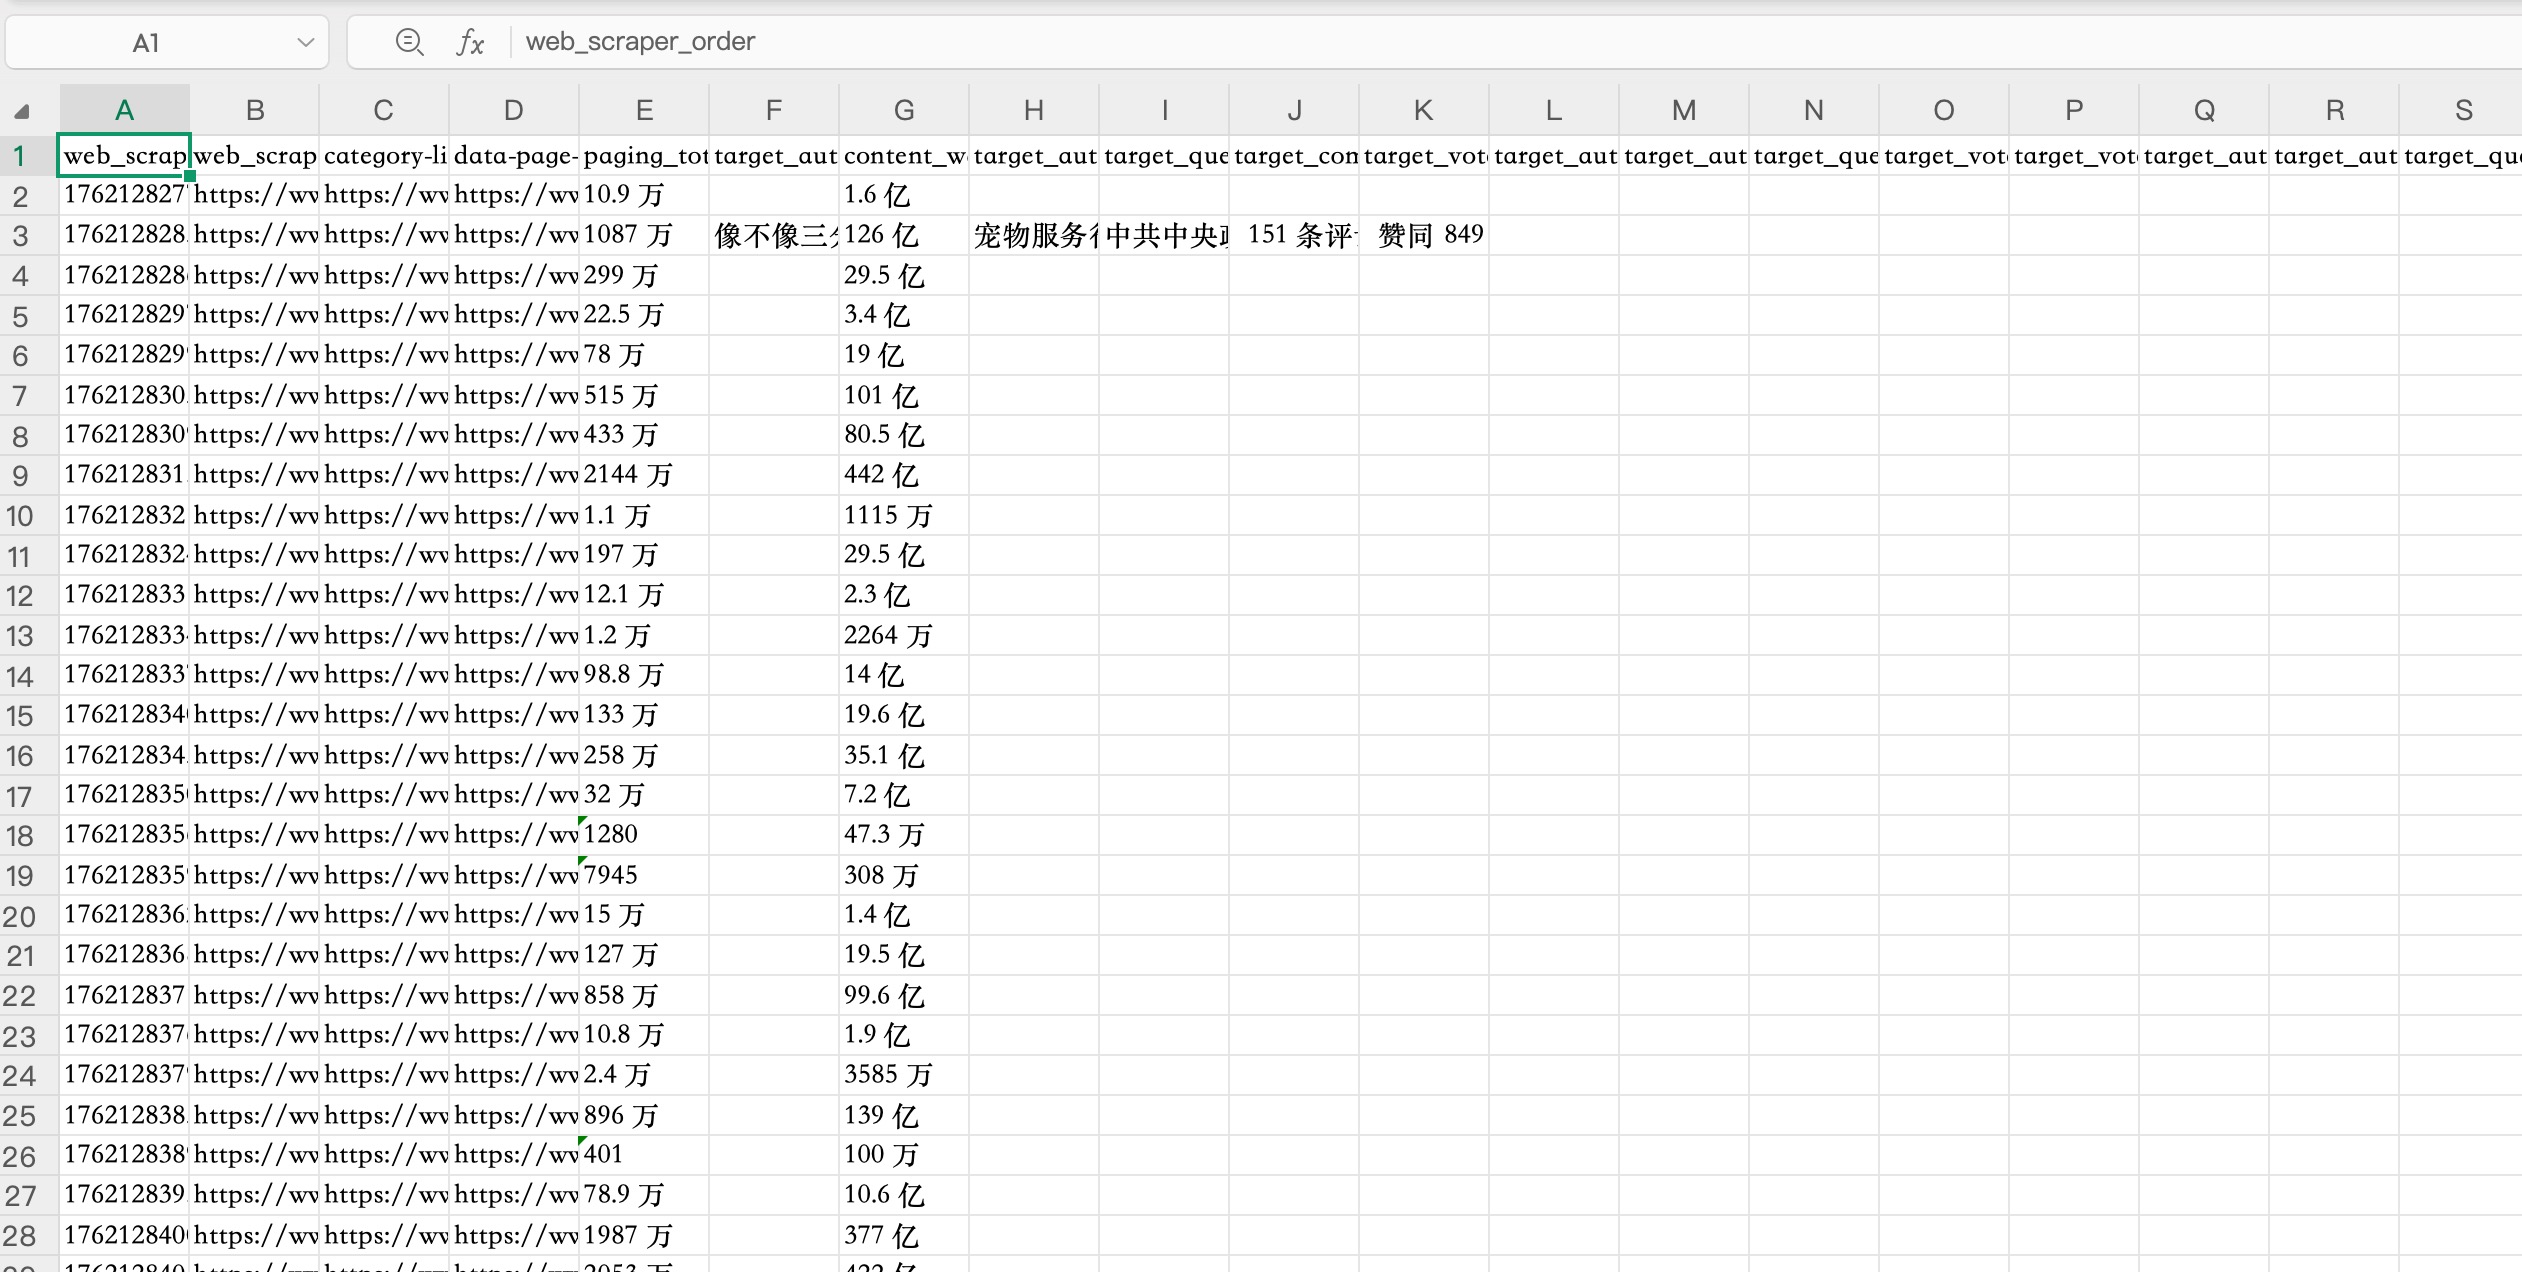
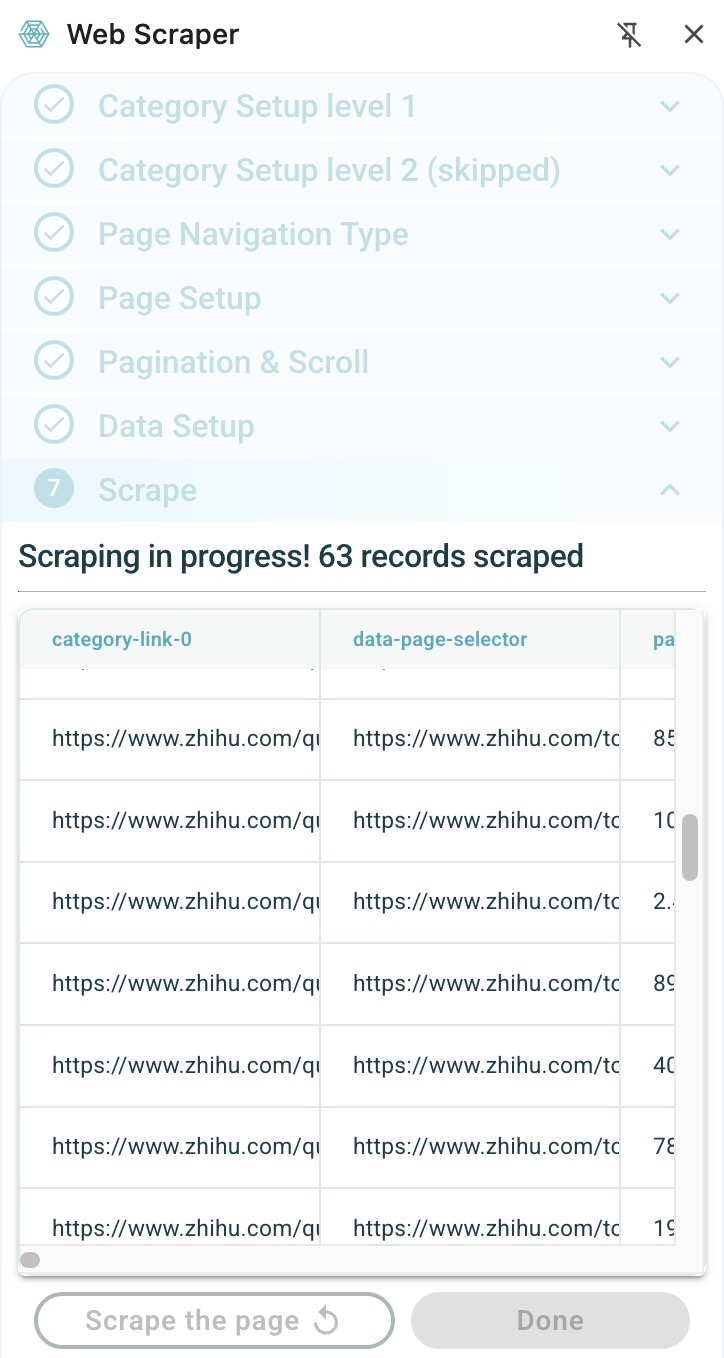
Web Scraping Process Image:
Week 4 Reflection
1. How do hierarchies and binaries manifest in data collection and classification?
The algorithms are designed by humans, and thus they reflect the existing social hierarchies and biases. For instance, the algorithms of some companies have been criticized for replicating and reinforcing racial and gender biases.
By collecting and processing users' data, internet companies have created a new economic and social hierarchy, with a few global companies dominating it.
The platforms often claims to be objective and neutral, but in actual operation, it frequently exhibits binary opposition situations, such as in terms of race and gender.
And the dichotomous treatment of speech and writing.
All of this is an act of dominating through the technology.
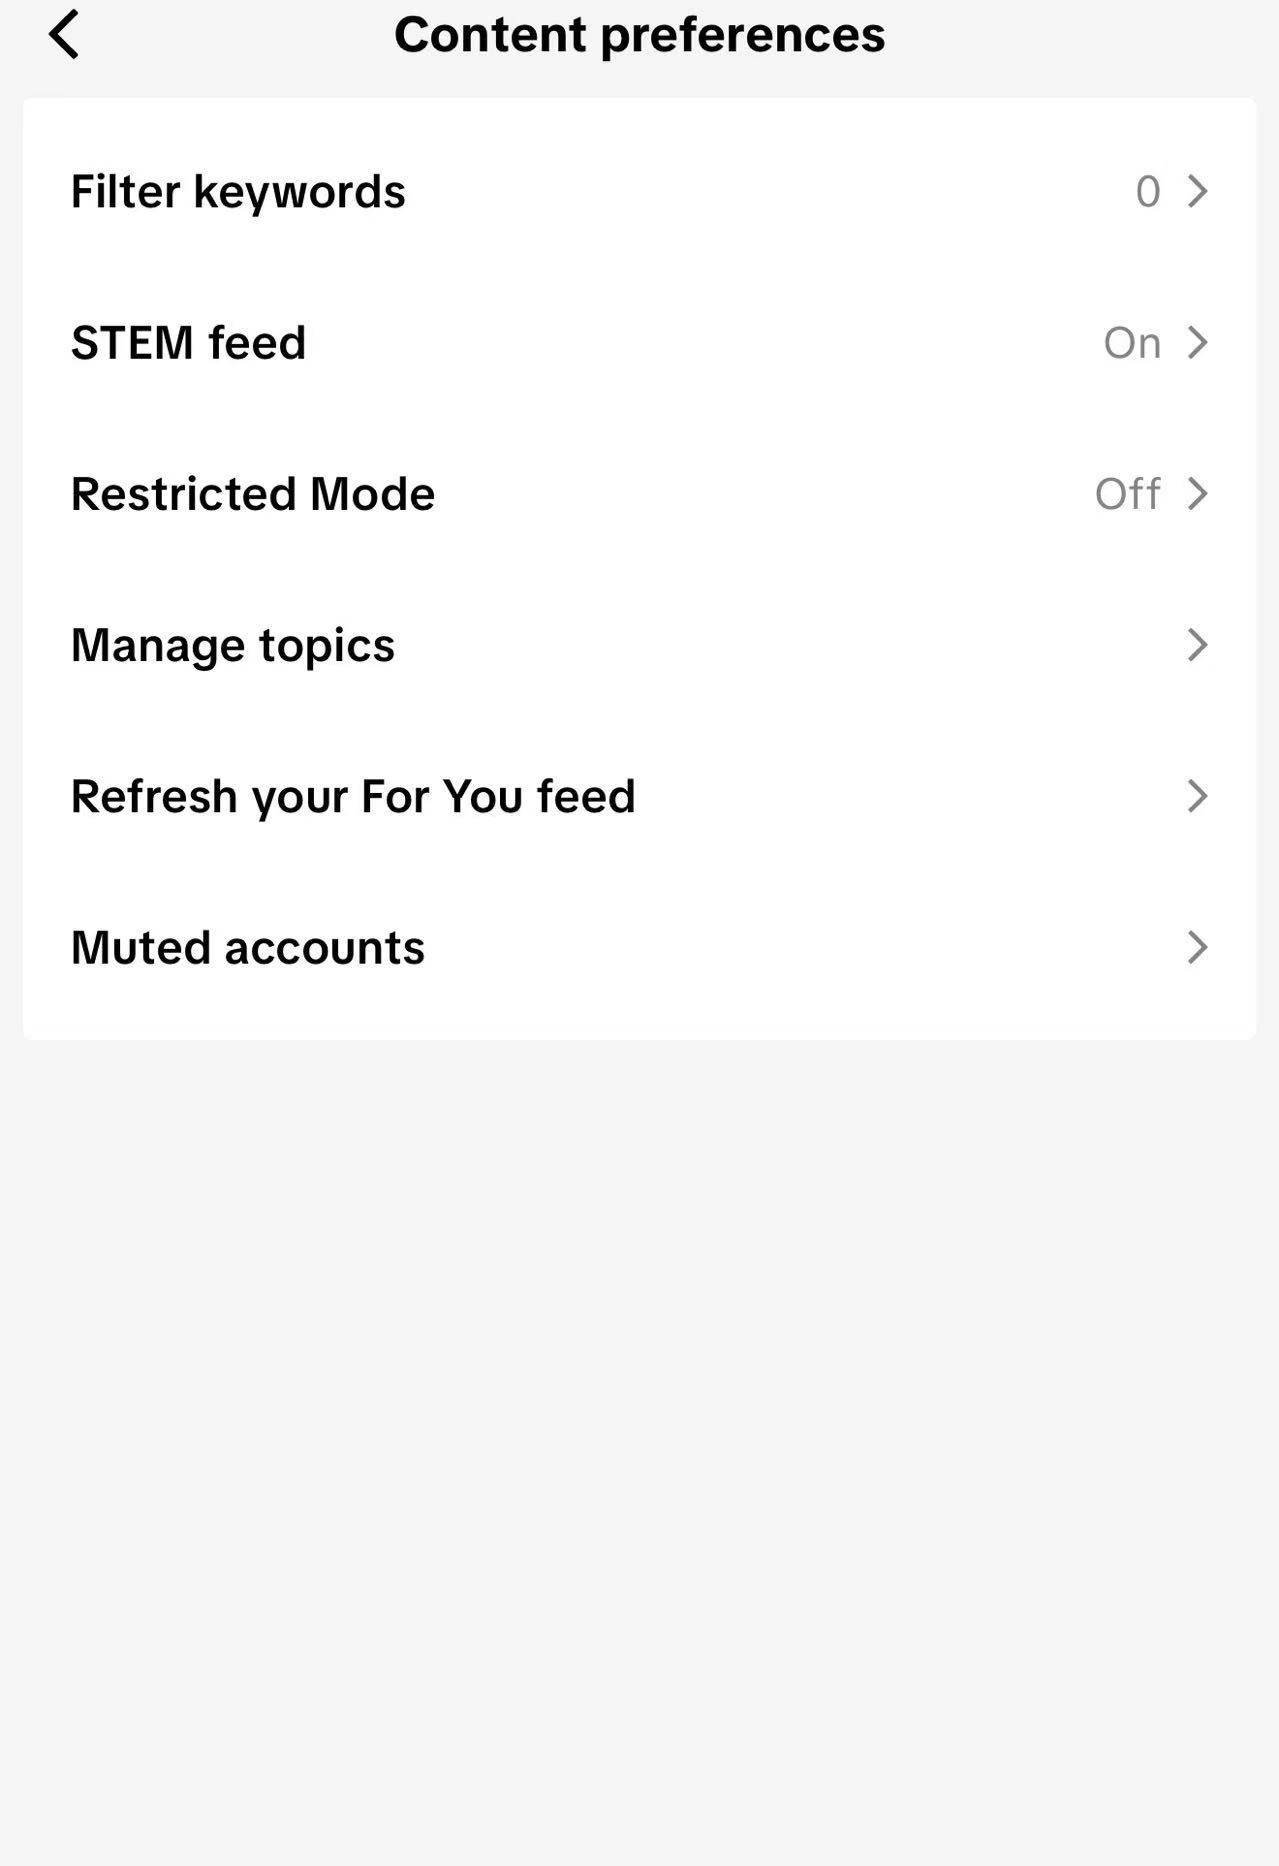
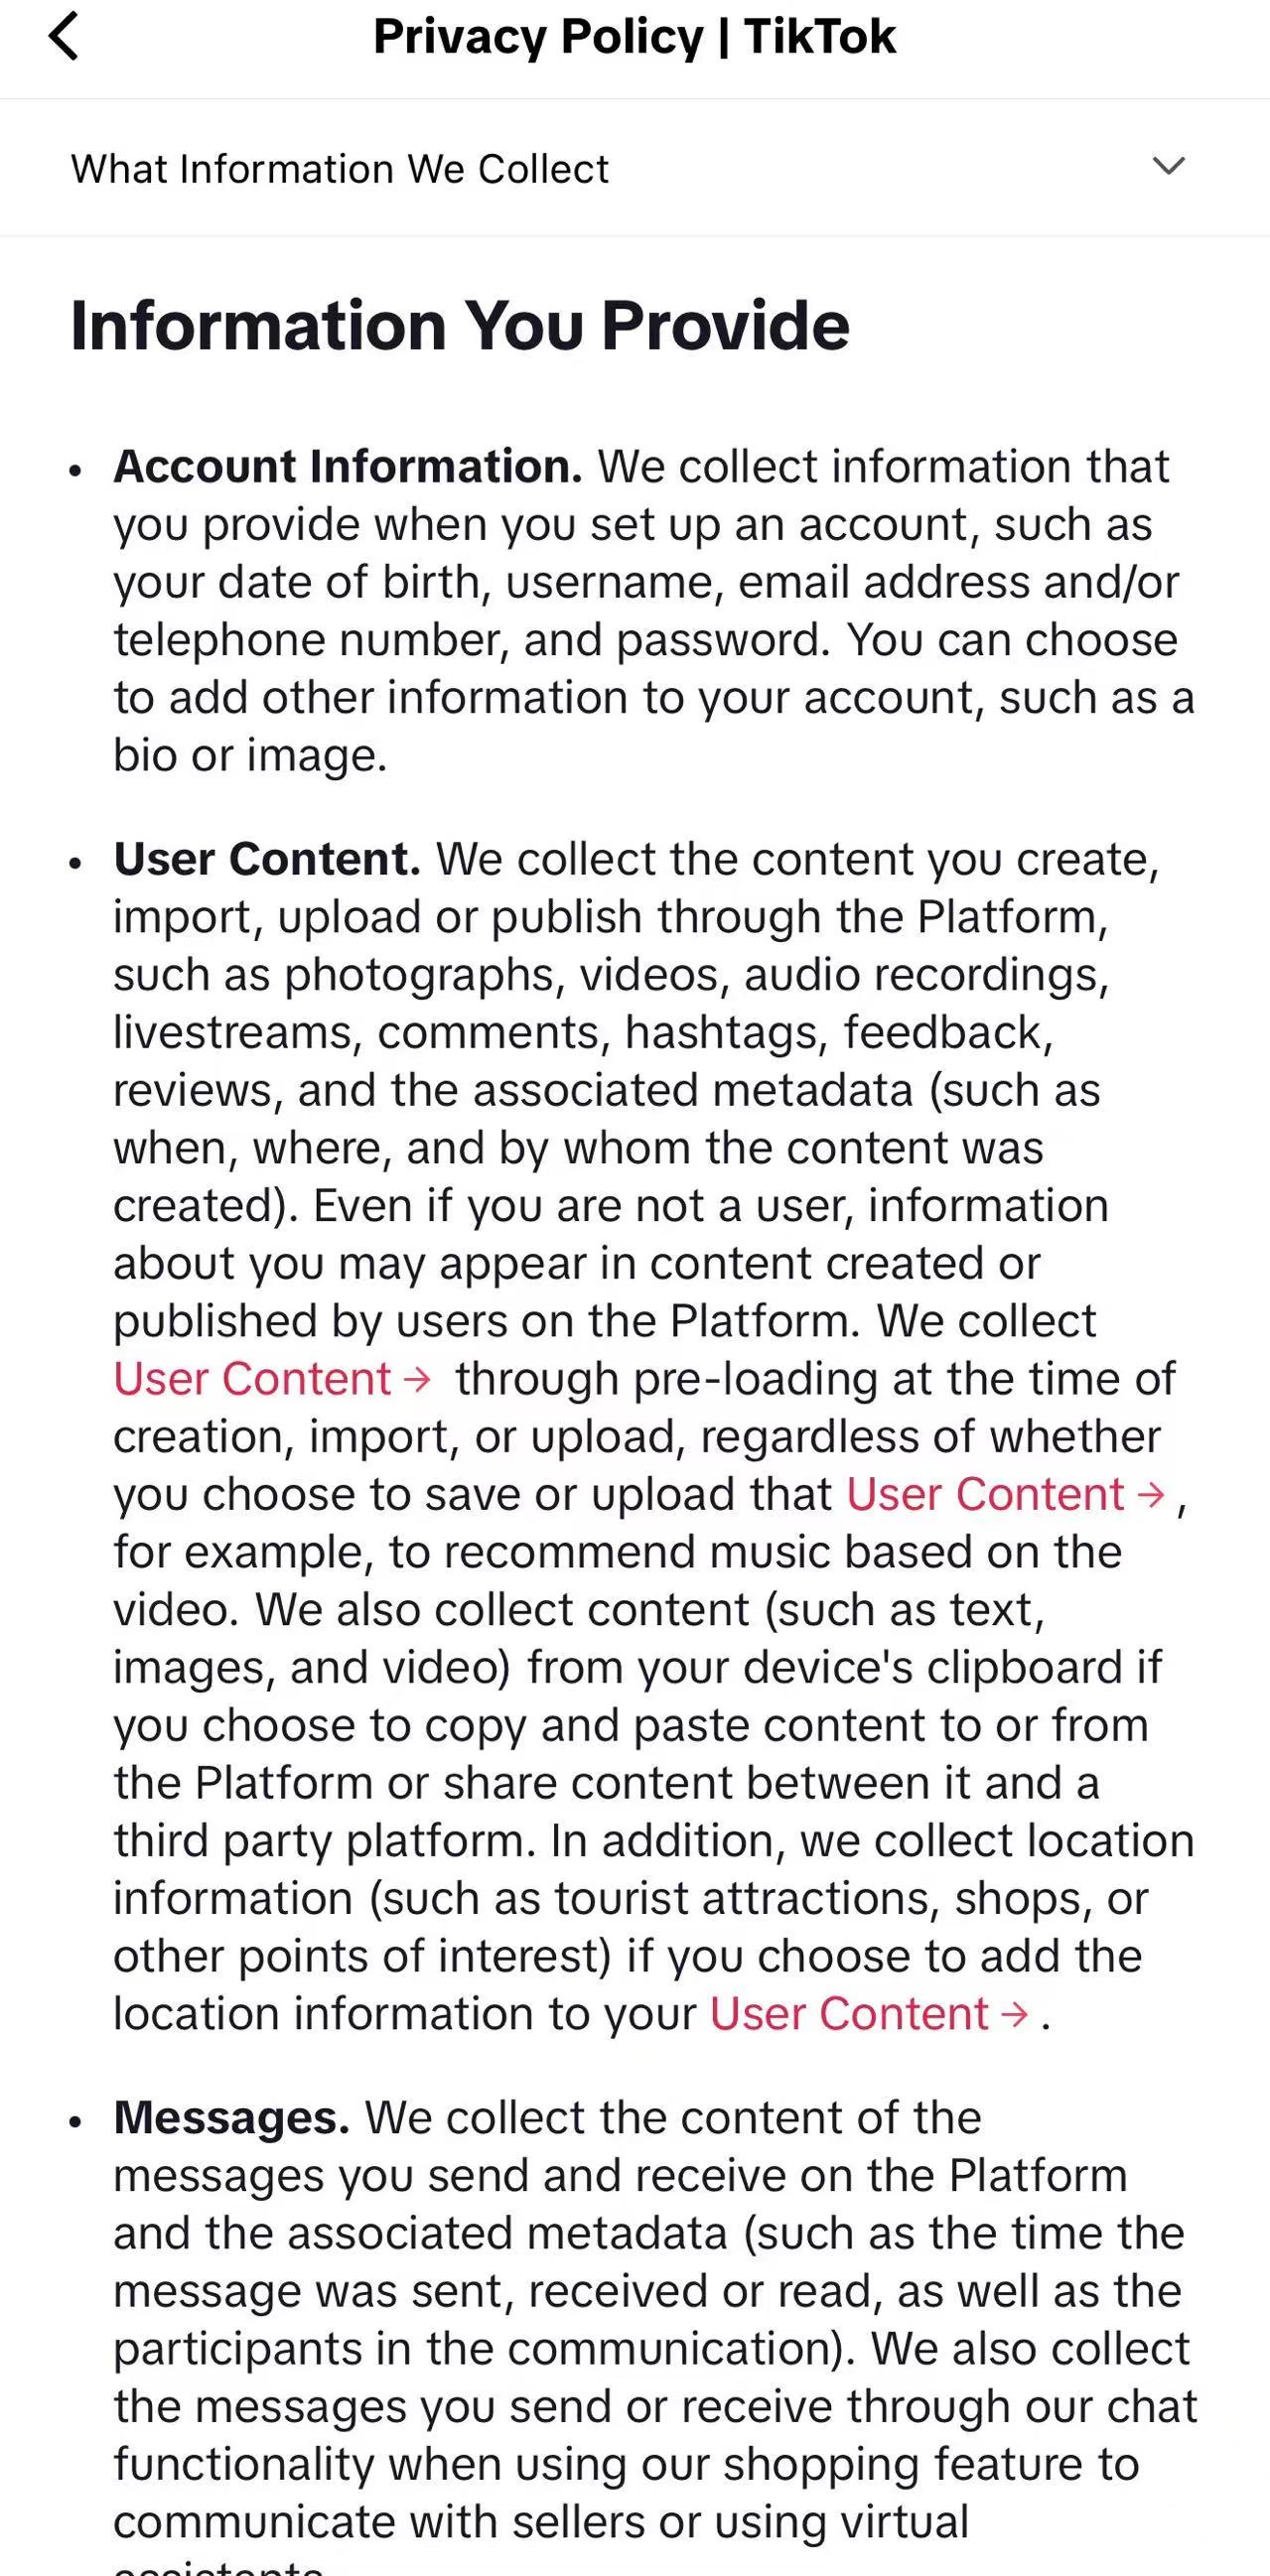
2. Having completed the readings, consider your own experiences of using digital media. Pick a social media platform, application or service that you use regularly. What kinds of data do you consent to being collected? Do you know how that data is used? How does it shape your experience?
The social platform that I frequently use is TikTok. I will agree that my browsing habits and preferences will be collected. These data should be processed and integrated to enable the platform to better understand users' preferences, thereby pushing content that aligns with their interests. From the perspective of user experience, these programs allow me to see more of the content I like, but they also result in a certain degree of information isolation.
Week 5 Reflection
1. What is the ideological work of data visualisation? How do data representations represent knowledge?
Data Visualization, as a research method, can help us simplify the data through a series of statistical, testing and processing procedures, presenting the data in a more intuitive form before our eyes. Some people will utilize their skills and resources to process data and present their subjective conclusions in order to gain benefits. This is a matter that requires serious vigilance. Data Visualization, as a research method, can help us simplify the data through a series of statistical, testing and processing procedures, presenting the data in a more intuitive form before our eyes. Some people will utilize their skills and resources to process data and present their subjective conclusions in order to gain benefits. This is a matter that requires serious vigilance.
By using certain technologies and tools, we can organize the data into the form of spreadsheets and databases, then the data can clearly represent certain knowledge.
2. How does a feminist data visualisation help you to understand and address potential bias in your data?
Feminist data visualization uses technology to clearly present certain issues related to positions and backgrounds. For instance, it presents clear data on the working hours, salaries, holidays, work achievements, and their contribution to families, in order to reveal that both men and women are crucial to society and families, and that men and women are equal.
3. You have now read one of the stories published on The Pudding. Do the author/s use visualisations in their essay effectively? Why or why not? Is there a visualisation that you particularly like? What about a visualisation that you particularly dislike? Why?
Yes, they effectively utilized data visualization. Because in the article, they clearly quoted statistical data and some spreadsheets, and these numbers could express information and support their viewpoints.
Citing spreadsheets in the article is my favorite way, because this method can be combined with the story, integrating numbers and charts with the content of the article to make the expression more intuitive and specific.
Week 6 Reflection
1. How does Sumpter (2017) classify his friends?
He classifies his friends through more than ten categories and many dimensions, includes family/partner, outdoors, work, jokes/memes,product/advertising, politics/news, music/sport/film, animals, friends, local events, thoughts/reflections, activism and lifestyle.
2. What is 'algorithmic identity' (Cheney-Lippold, 2017)?
An identity category generated by algorithms based on a combination of an individual's behavioral data and platform statistical patterns. It is not an identity declared by the individual themselves, but rather a type of person that platforms and institutions infer you "might belong to" by analyzing your clicks, searches, locations, and other data according to their internal rules. This identity is variable and contextual, and is mainly used for governance purposes such as advertising, monitoring, and risk management.
3. Thought
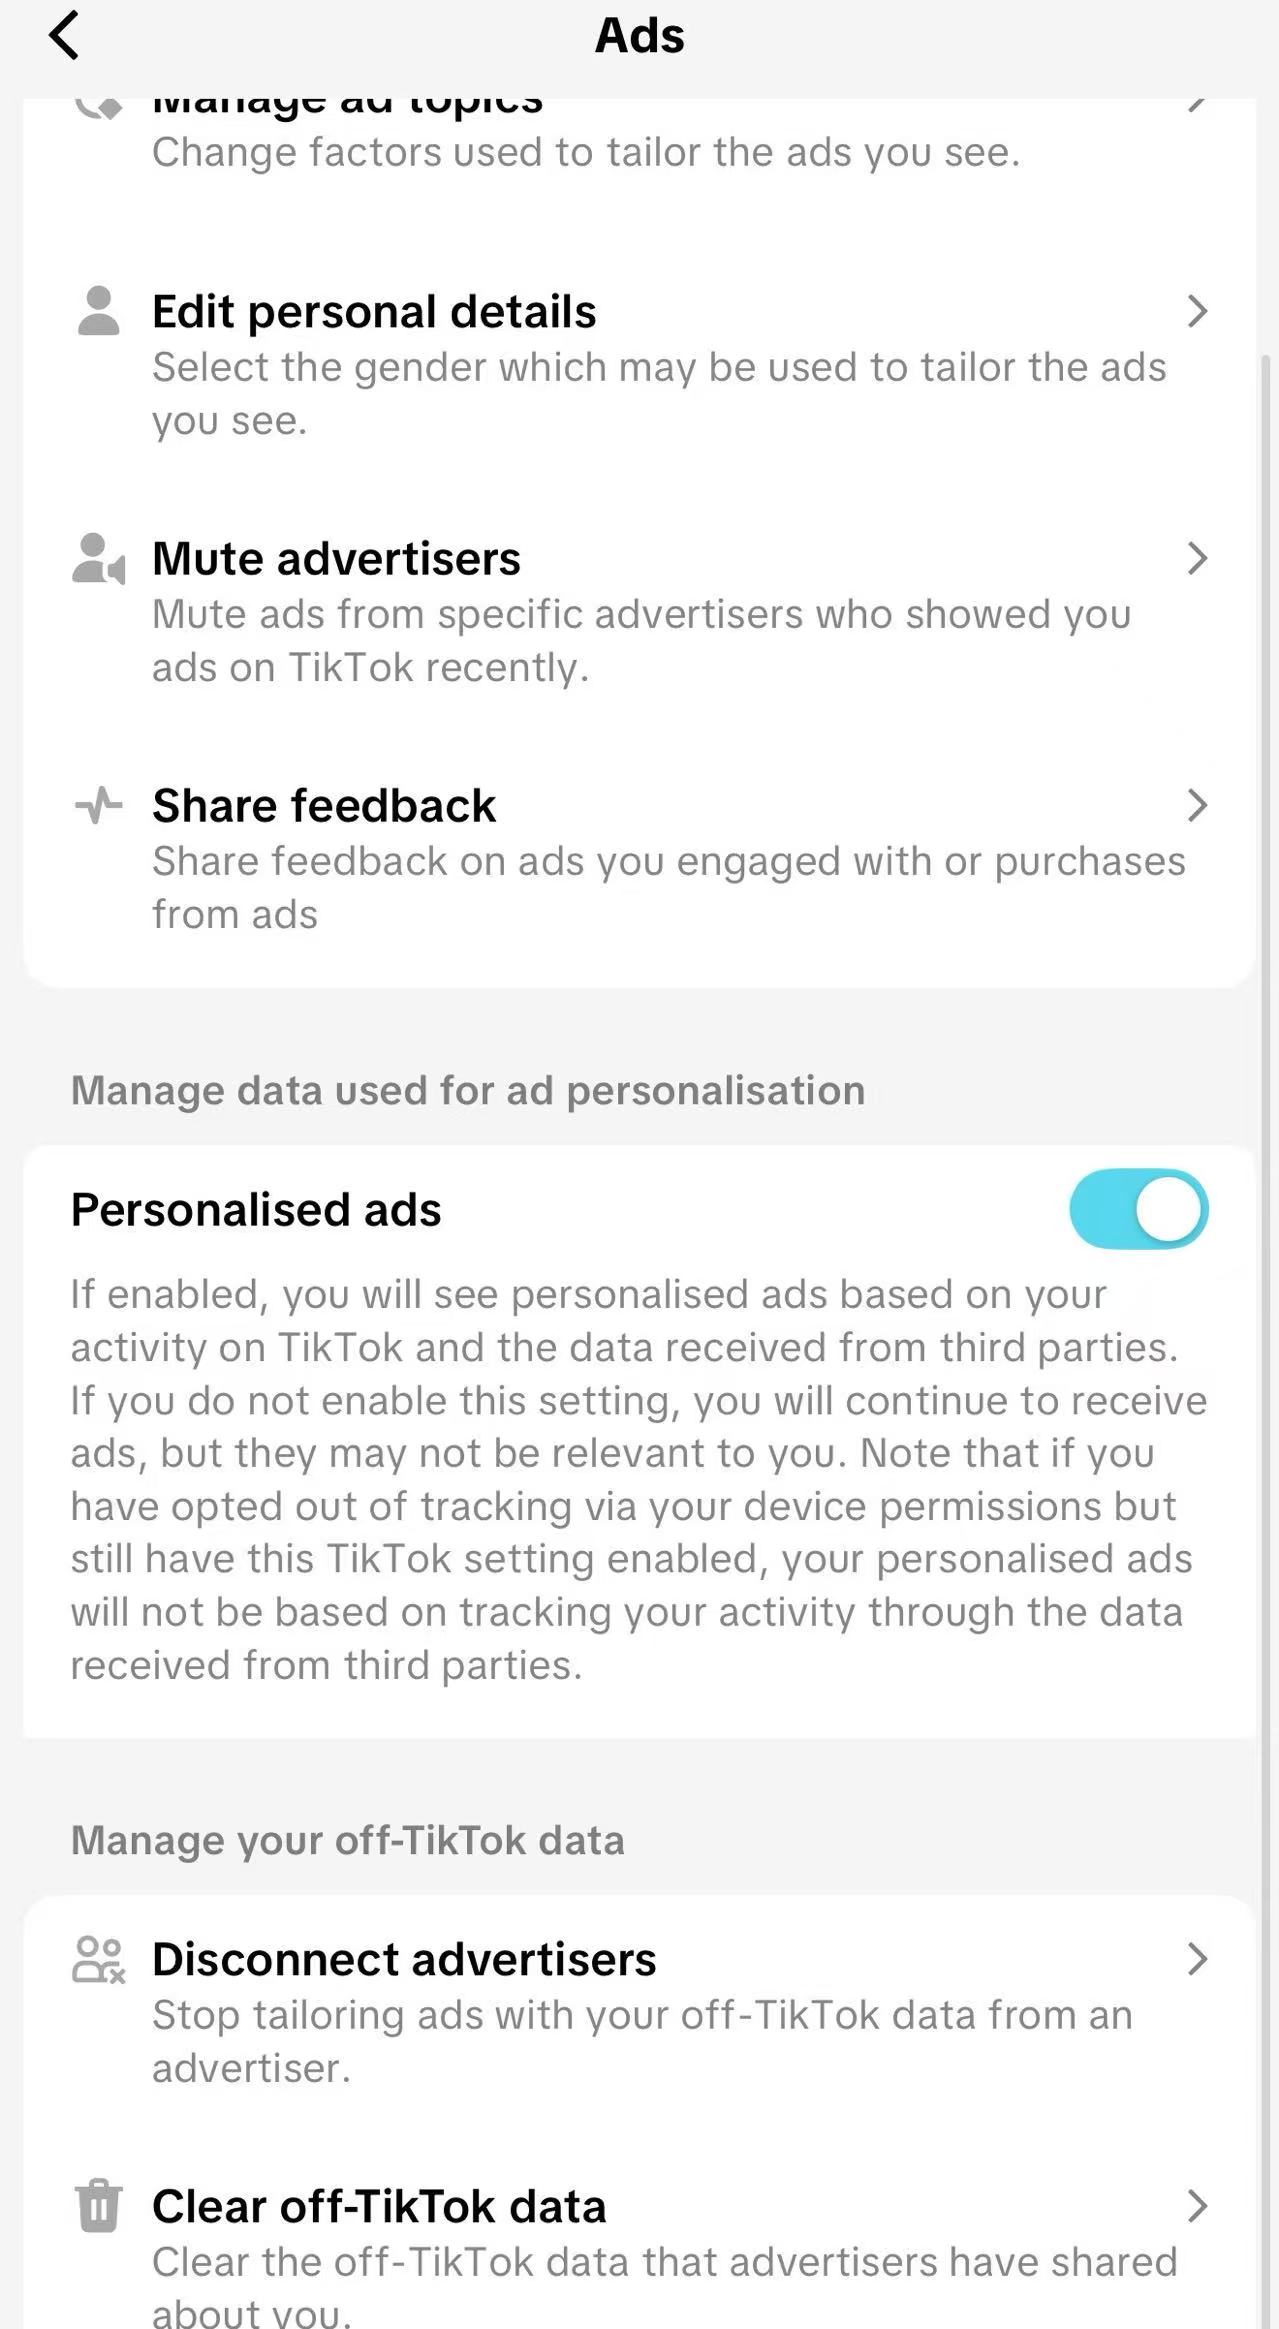
In Task 1, when I carefully examined TikTok's data input mechanism, I was the first to truly realize that the data I left on the platform was far more than what I actively provided. I originally thought that the platform only recorded the content I uploaded, but when I read the privacy policy, I discovered that the platform also continuously collected behavioral tracks, device information, and even generated interest tags based on inferences. This made me realize that the so-called "user consent" in reality is actually very passive. A lot of data is recorded and used without my being aware of it. Task 2 further enabled me to understand how these input data were transformed into the platform's output, especially in terms of ad recommendations. When I viewed the ad tags TikTok had placed on me, I clearly noticed that many of them did not align with my true interests. This mismatch made me realize that the algorithm was not "understanding me", but rather categorizing me as a certain "user type that could be utilized by the advertising system". Even though the platform offered some ad management options, I gradually realized that these controls only operated at a very superficial level, while the underlying inference mechanism and classification logic remained completely opaque. This made me reflect: How much "control" do users have in the platform ecosystem? Which seemingly open functions are actually just symbolic choices? In Task 3, I applied Sumpter's PCA method to reduce the dimensions of my friends' data and create charts. This process made me deeply appreciate the efficiency and simplification capabilities of the algorithm when dealing with complex social behaviors. With just a few steps, I was able to compress the multi-dimensional behaviors of over thirty friends into two principal components, which seemed clear yet highly abstract. This experience made me realize that the "understanding" of algorithms is not an exact representation of reality, but rather a compression and reconfiguration of reality. The coordinate points in the PCA chart seem objective, but they ignore the complexity of emotions, context, and relationships. Therefore, I gained a deeper understanding that the abstraction and classification of platforms for users fundamentally have limitations, and we often fail to notice this "simplification" process in our daily use.
Image:
Week 7 Reflection
1. What is negative prompting?
Negative prompting refers to the method of giving instructions to generative AI models by explicitly telling them what "should not appear" or "not to generate content in a certain way" during interaction.
2. Consider your own uses of generative AI. How does the concept of negative prompting shape your understanding of how machine learning works?
During my interaction with generative AI, I discovered that "negative prompts" are extremely effective in revealing the operating mechanism of machine learning. When I asked the AI to avoid certain tones, styles, or narrative approaches, I was not giving it new capabilities; instead, I was forcing it to bypass the most frequently activated patterns in the training data. This process made me more clearly realize that the essence of generative models is probabilistic prediction, not semantic understanding. The reason why the AI changes its output is not because it understands the content I want to exclude, but because it statistically suppresses the high-probability paths and instead seeks other options that are still possible but less common. The negative feedback also allowed me to observe the "homogenization tendency" of the model. Without any constraints, AI often generates relatively moderate, universal, and risk-free content because such content appears most frequently in the training data. When I kept adding "Don't write like this" and "Avoid this style", I was actually pushing the model away from its default prediction structure and making it exhibit more heterogeneity. Therefore, the negative prompts have changed my understanding of machine learning: it is not a "language understanding" entity, but rather a system that relies on probability distributions, depends on the patterns of training data, and generates results through exclusion and weighting. Through negative prompts, I not only see its limitations, but also observe the "processual" aspect of the relationship between humans and the model. The change in AI does not come from internal thinking, but rather from how I constantly rewrite its prediction path. This has made me more deeply understand that the operation of generative AI relies on statistics, while creativity often comes from our continuous intervention in the predictability.
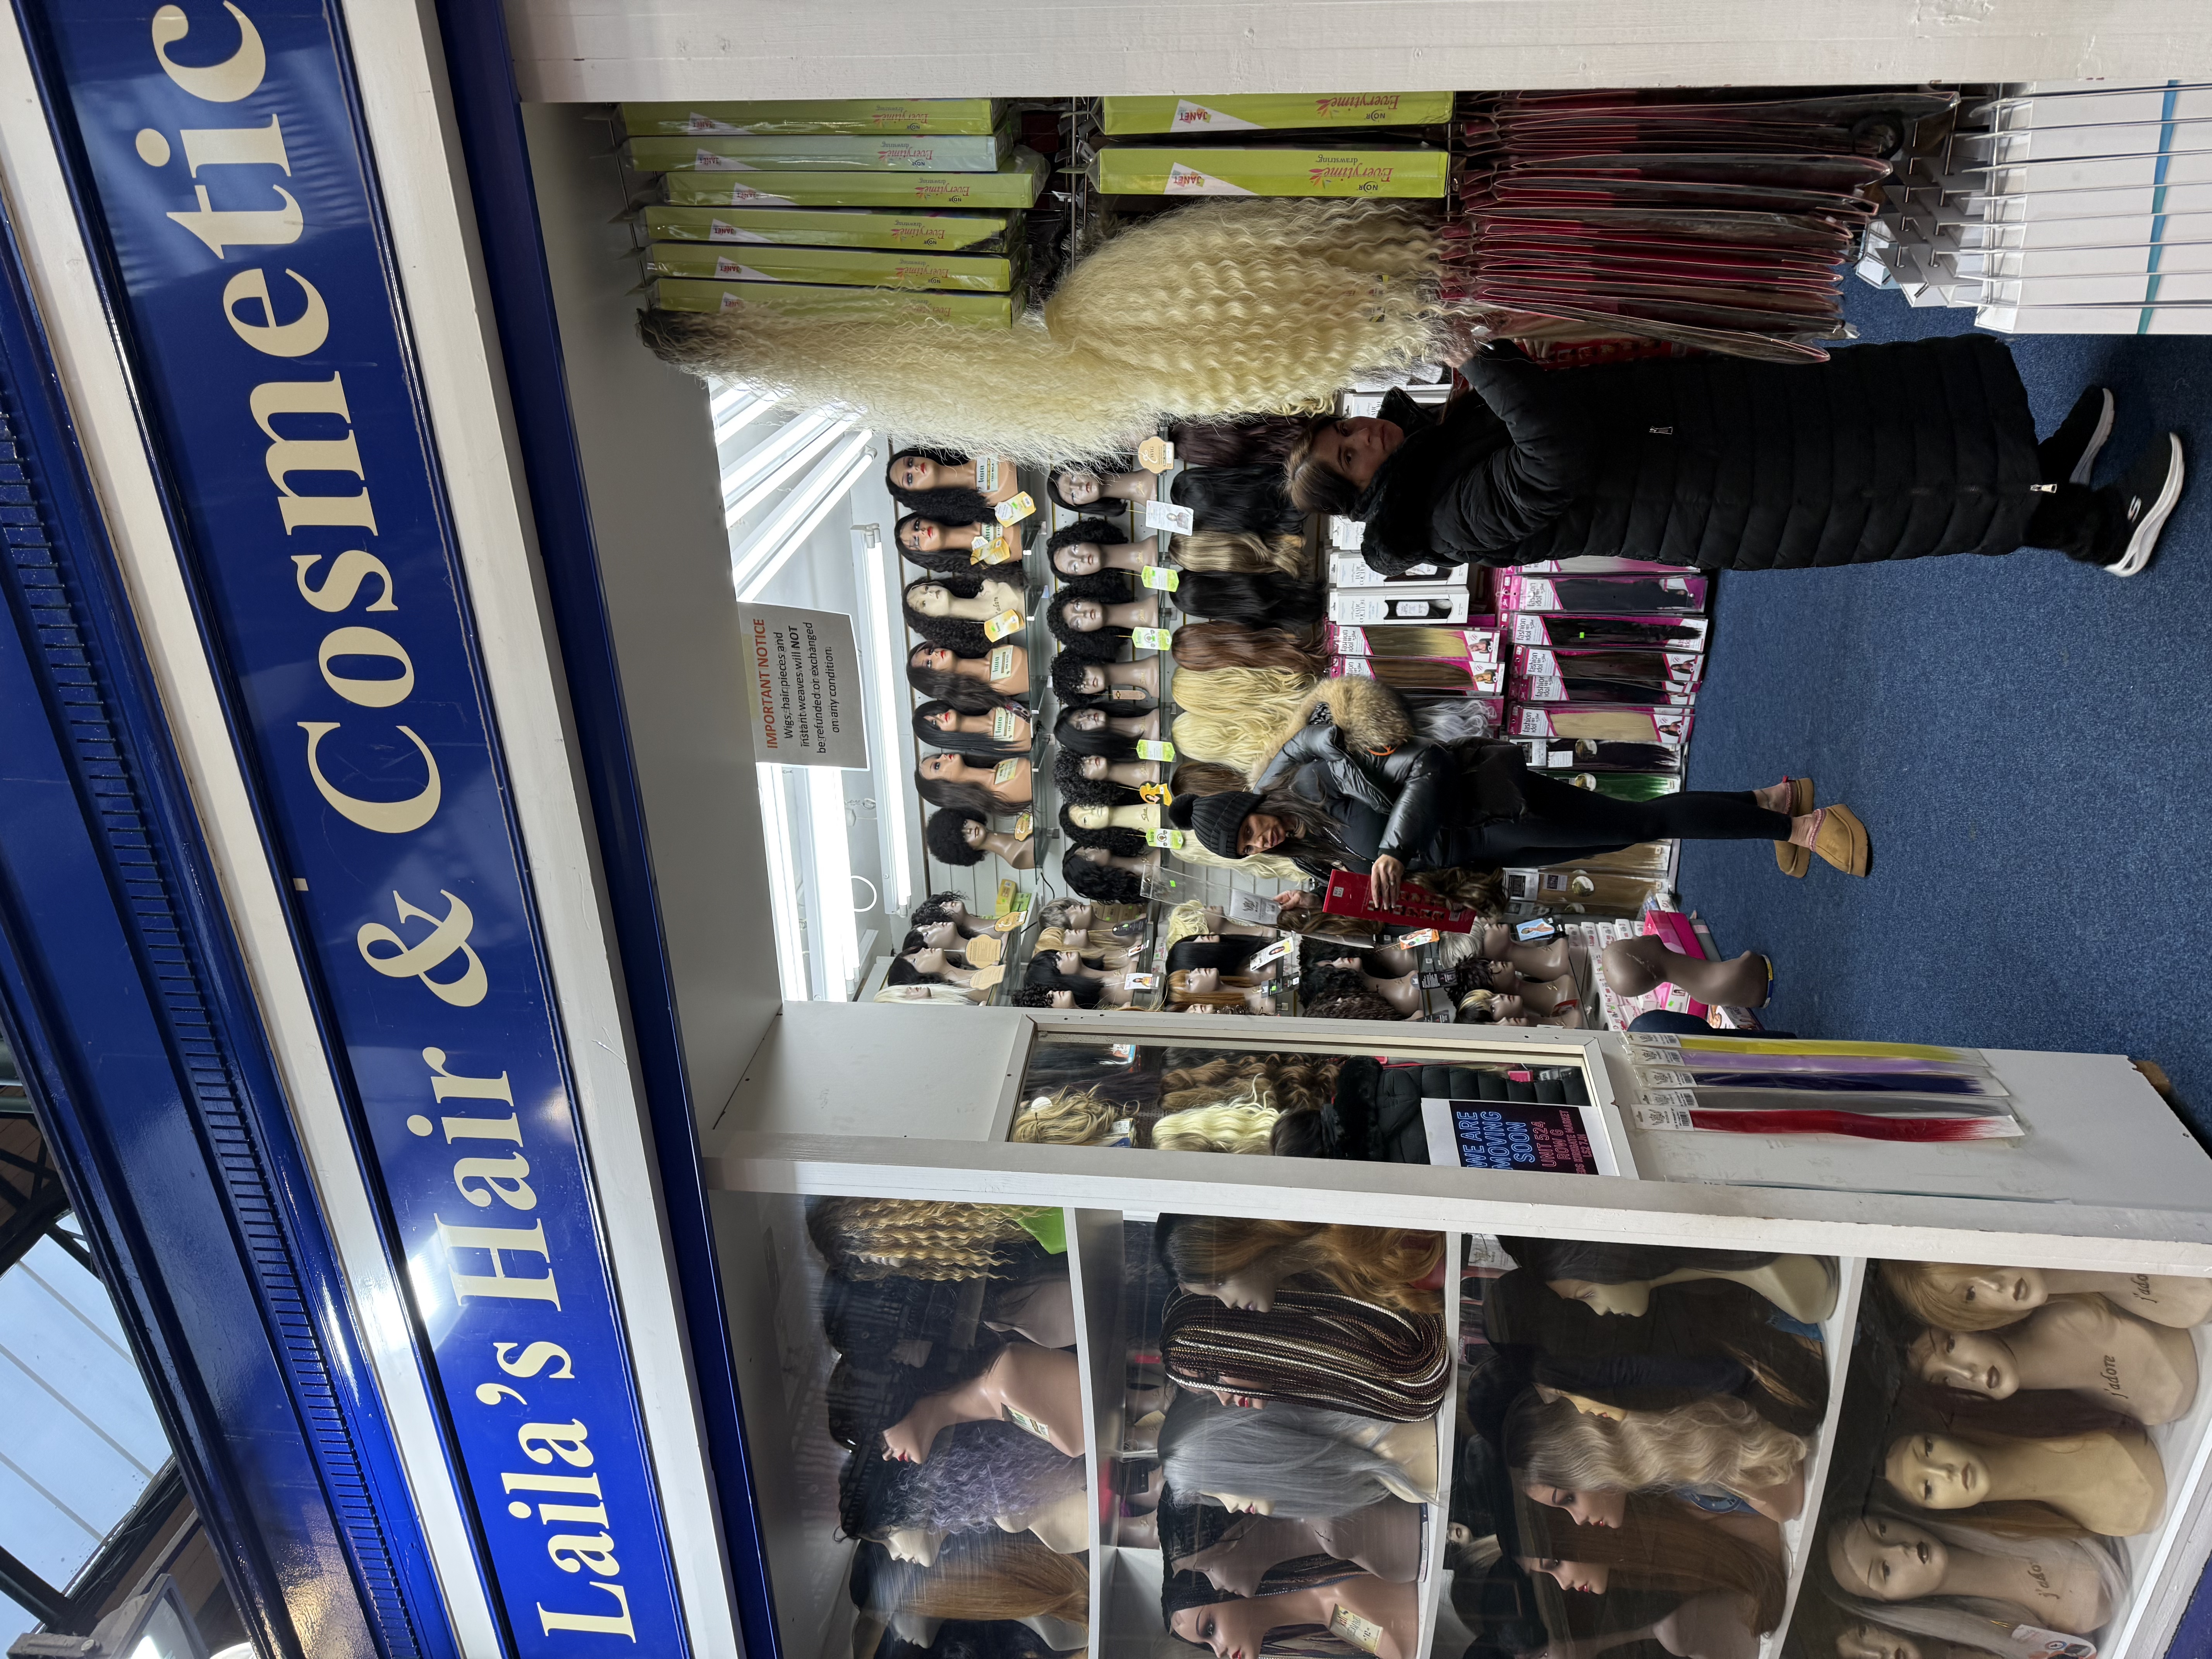
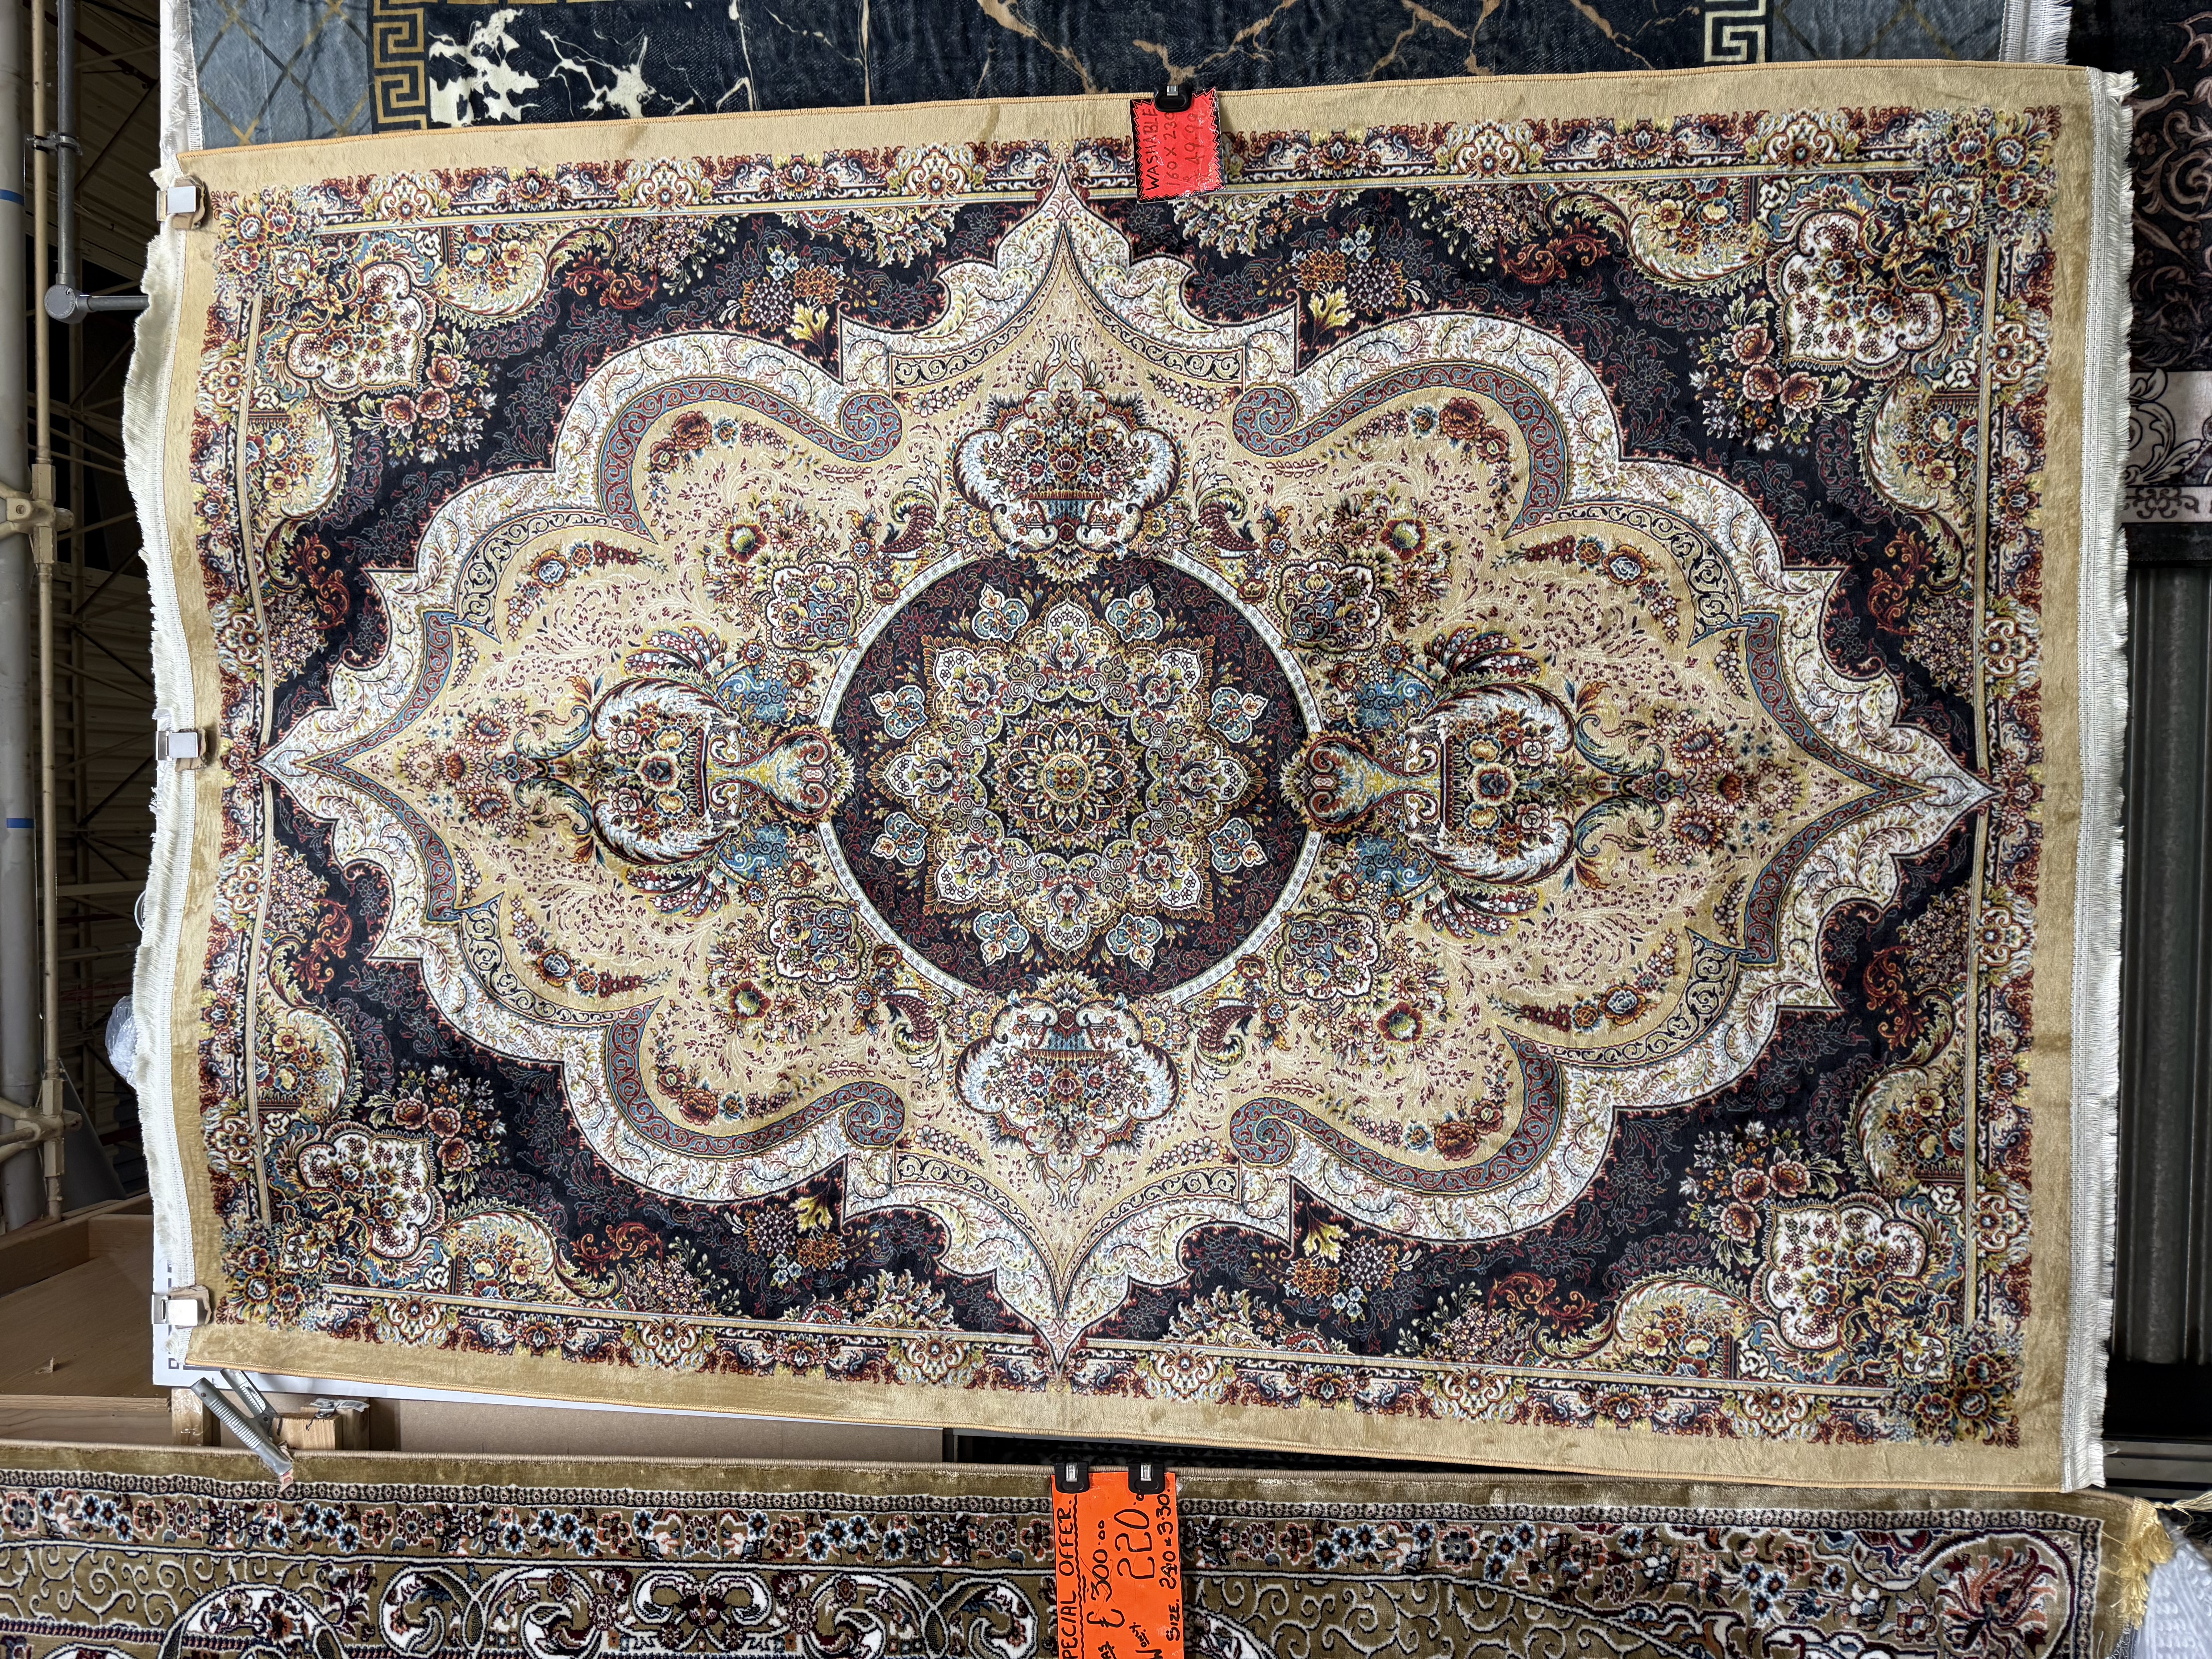
Week 8 Reflection
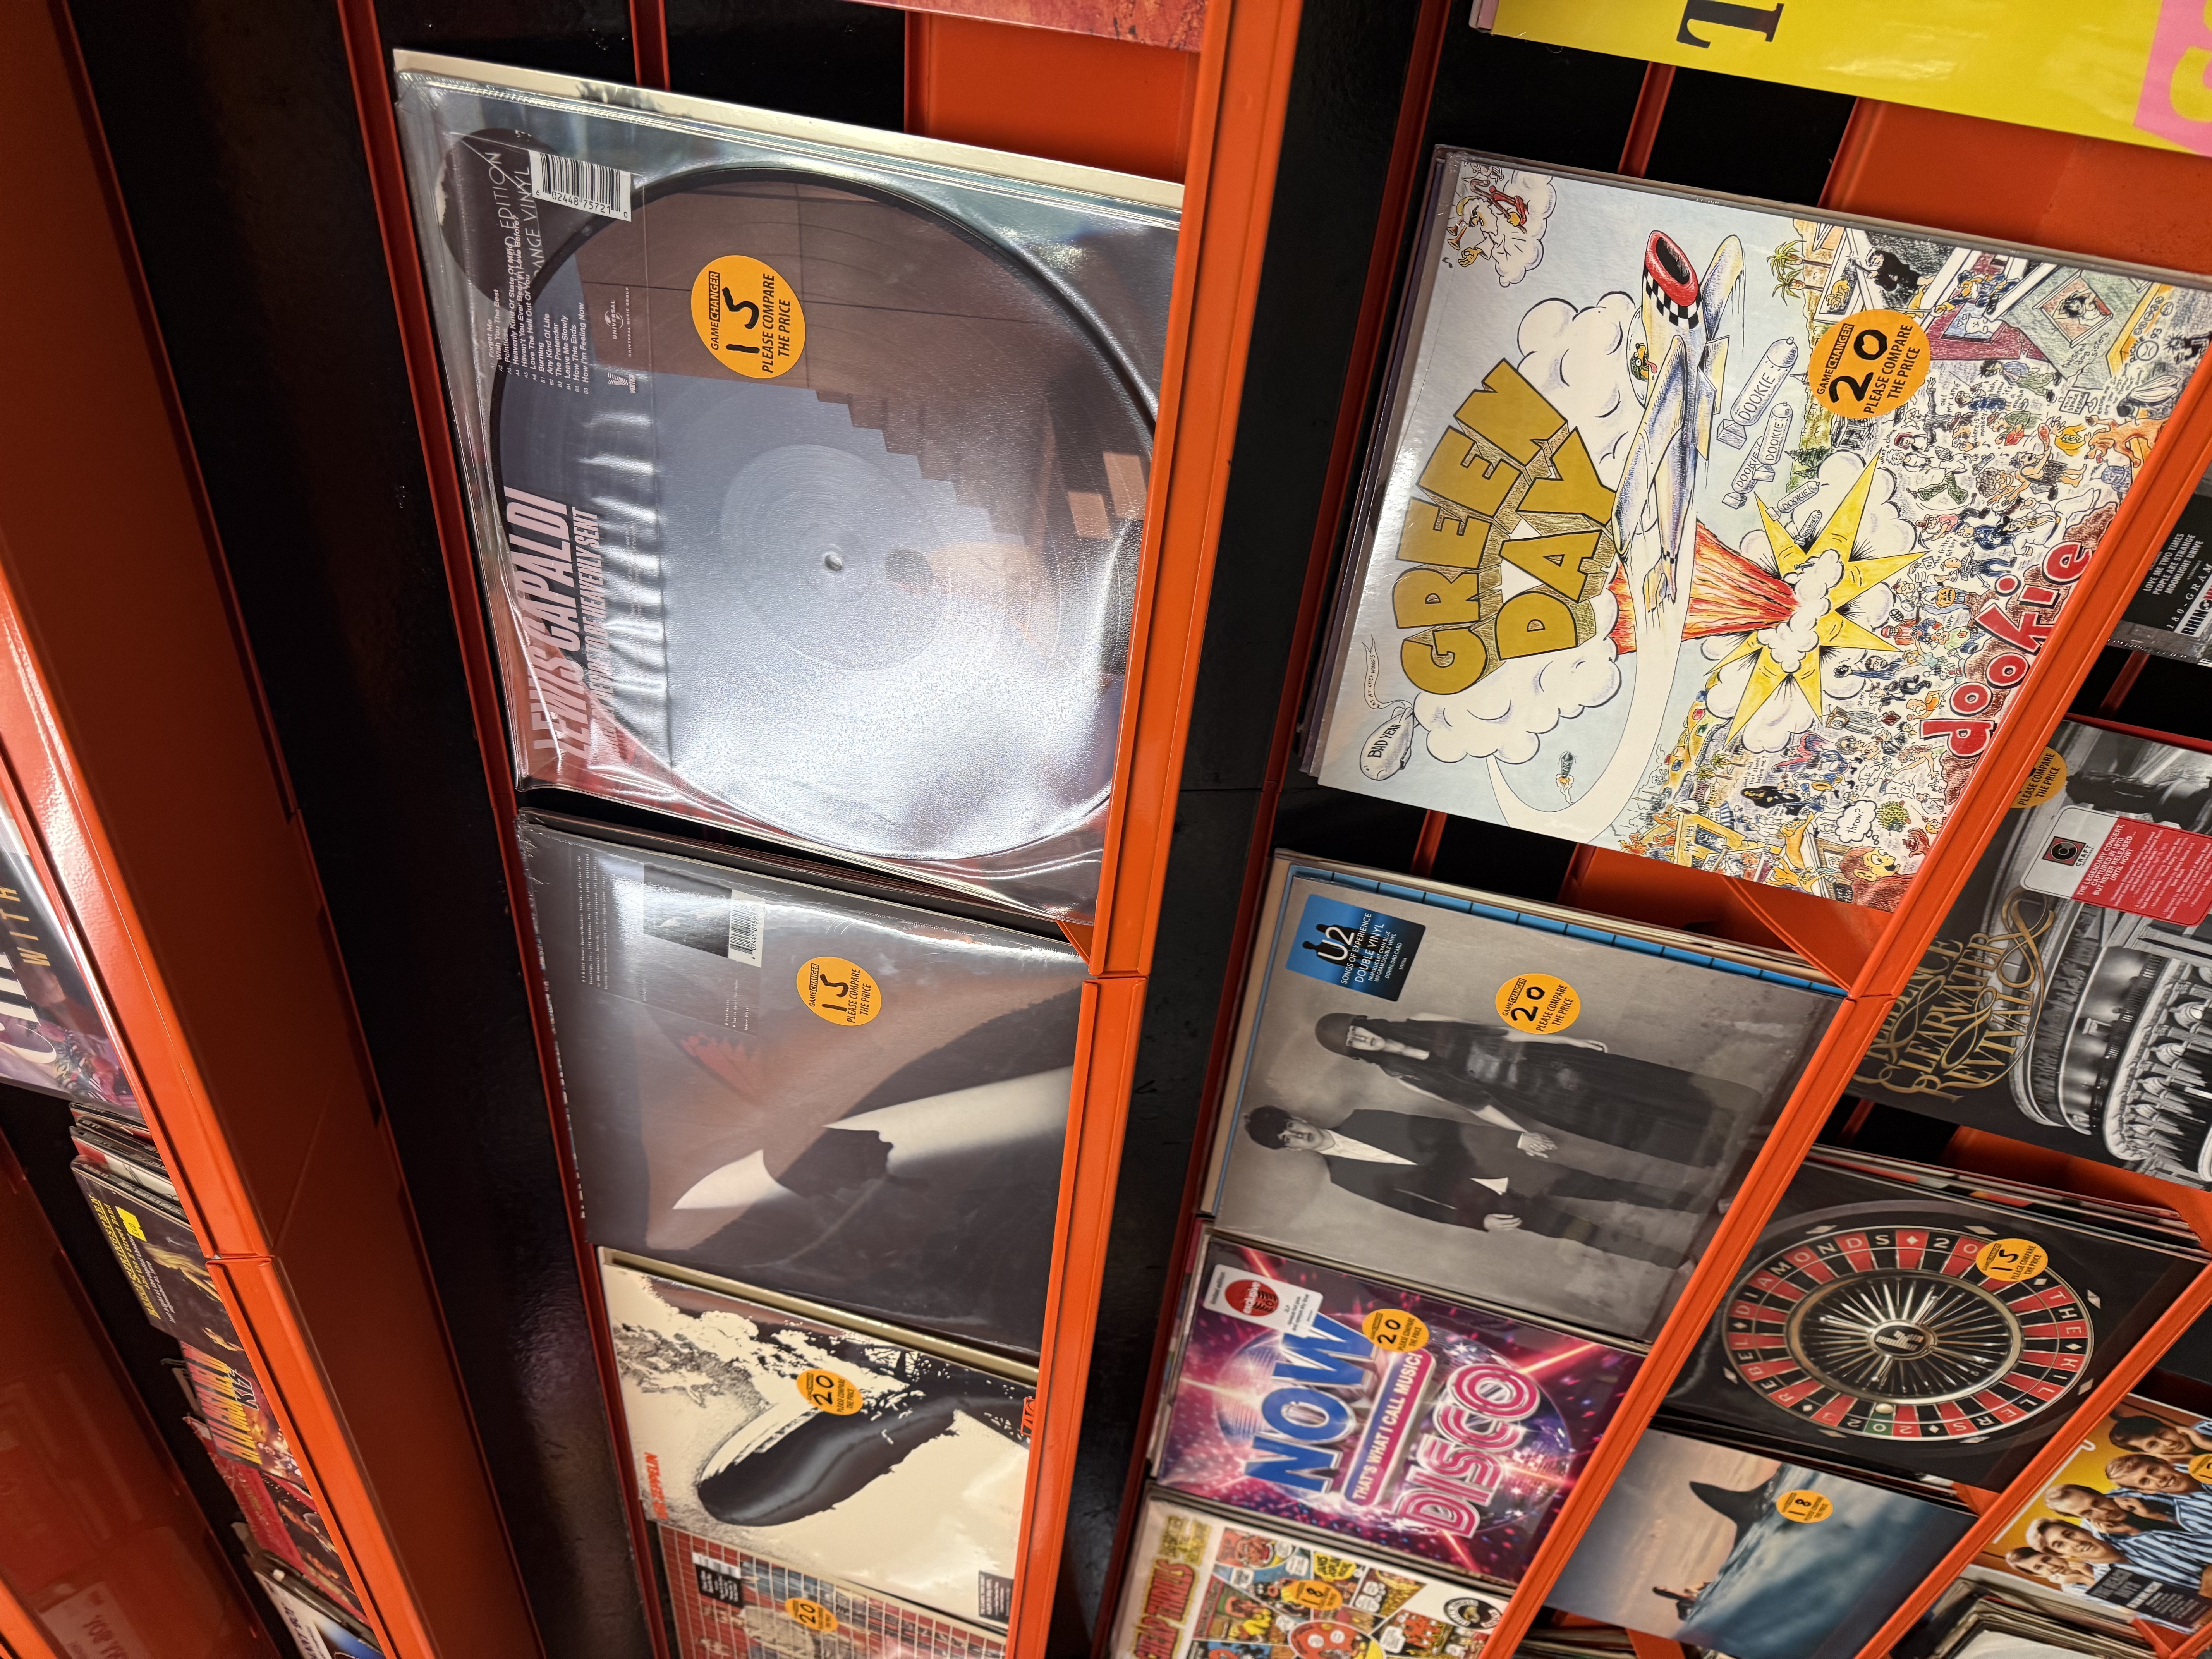
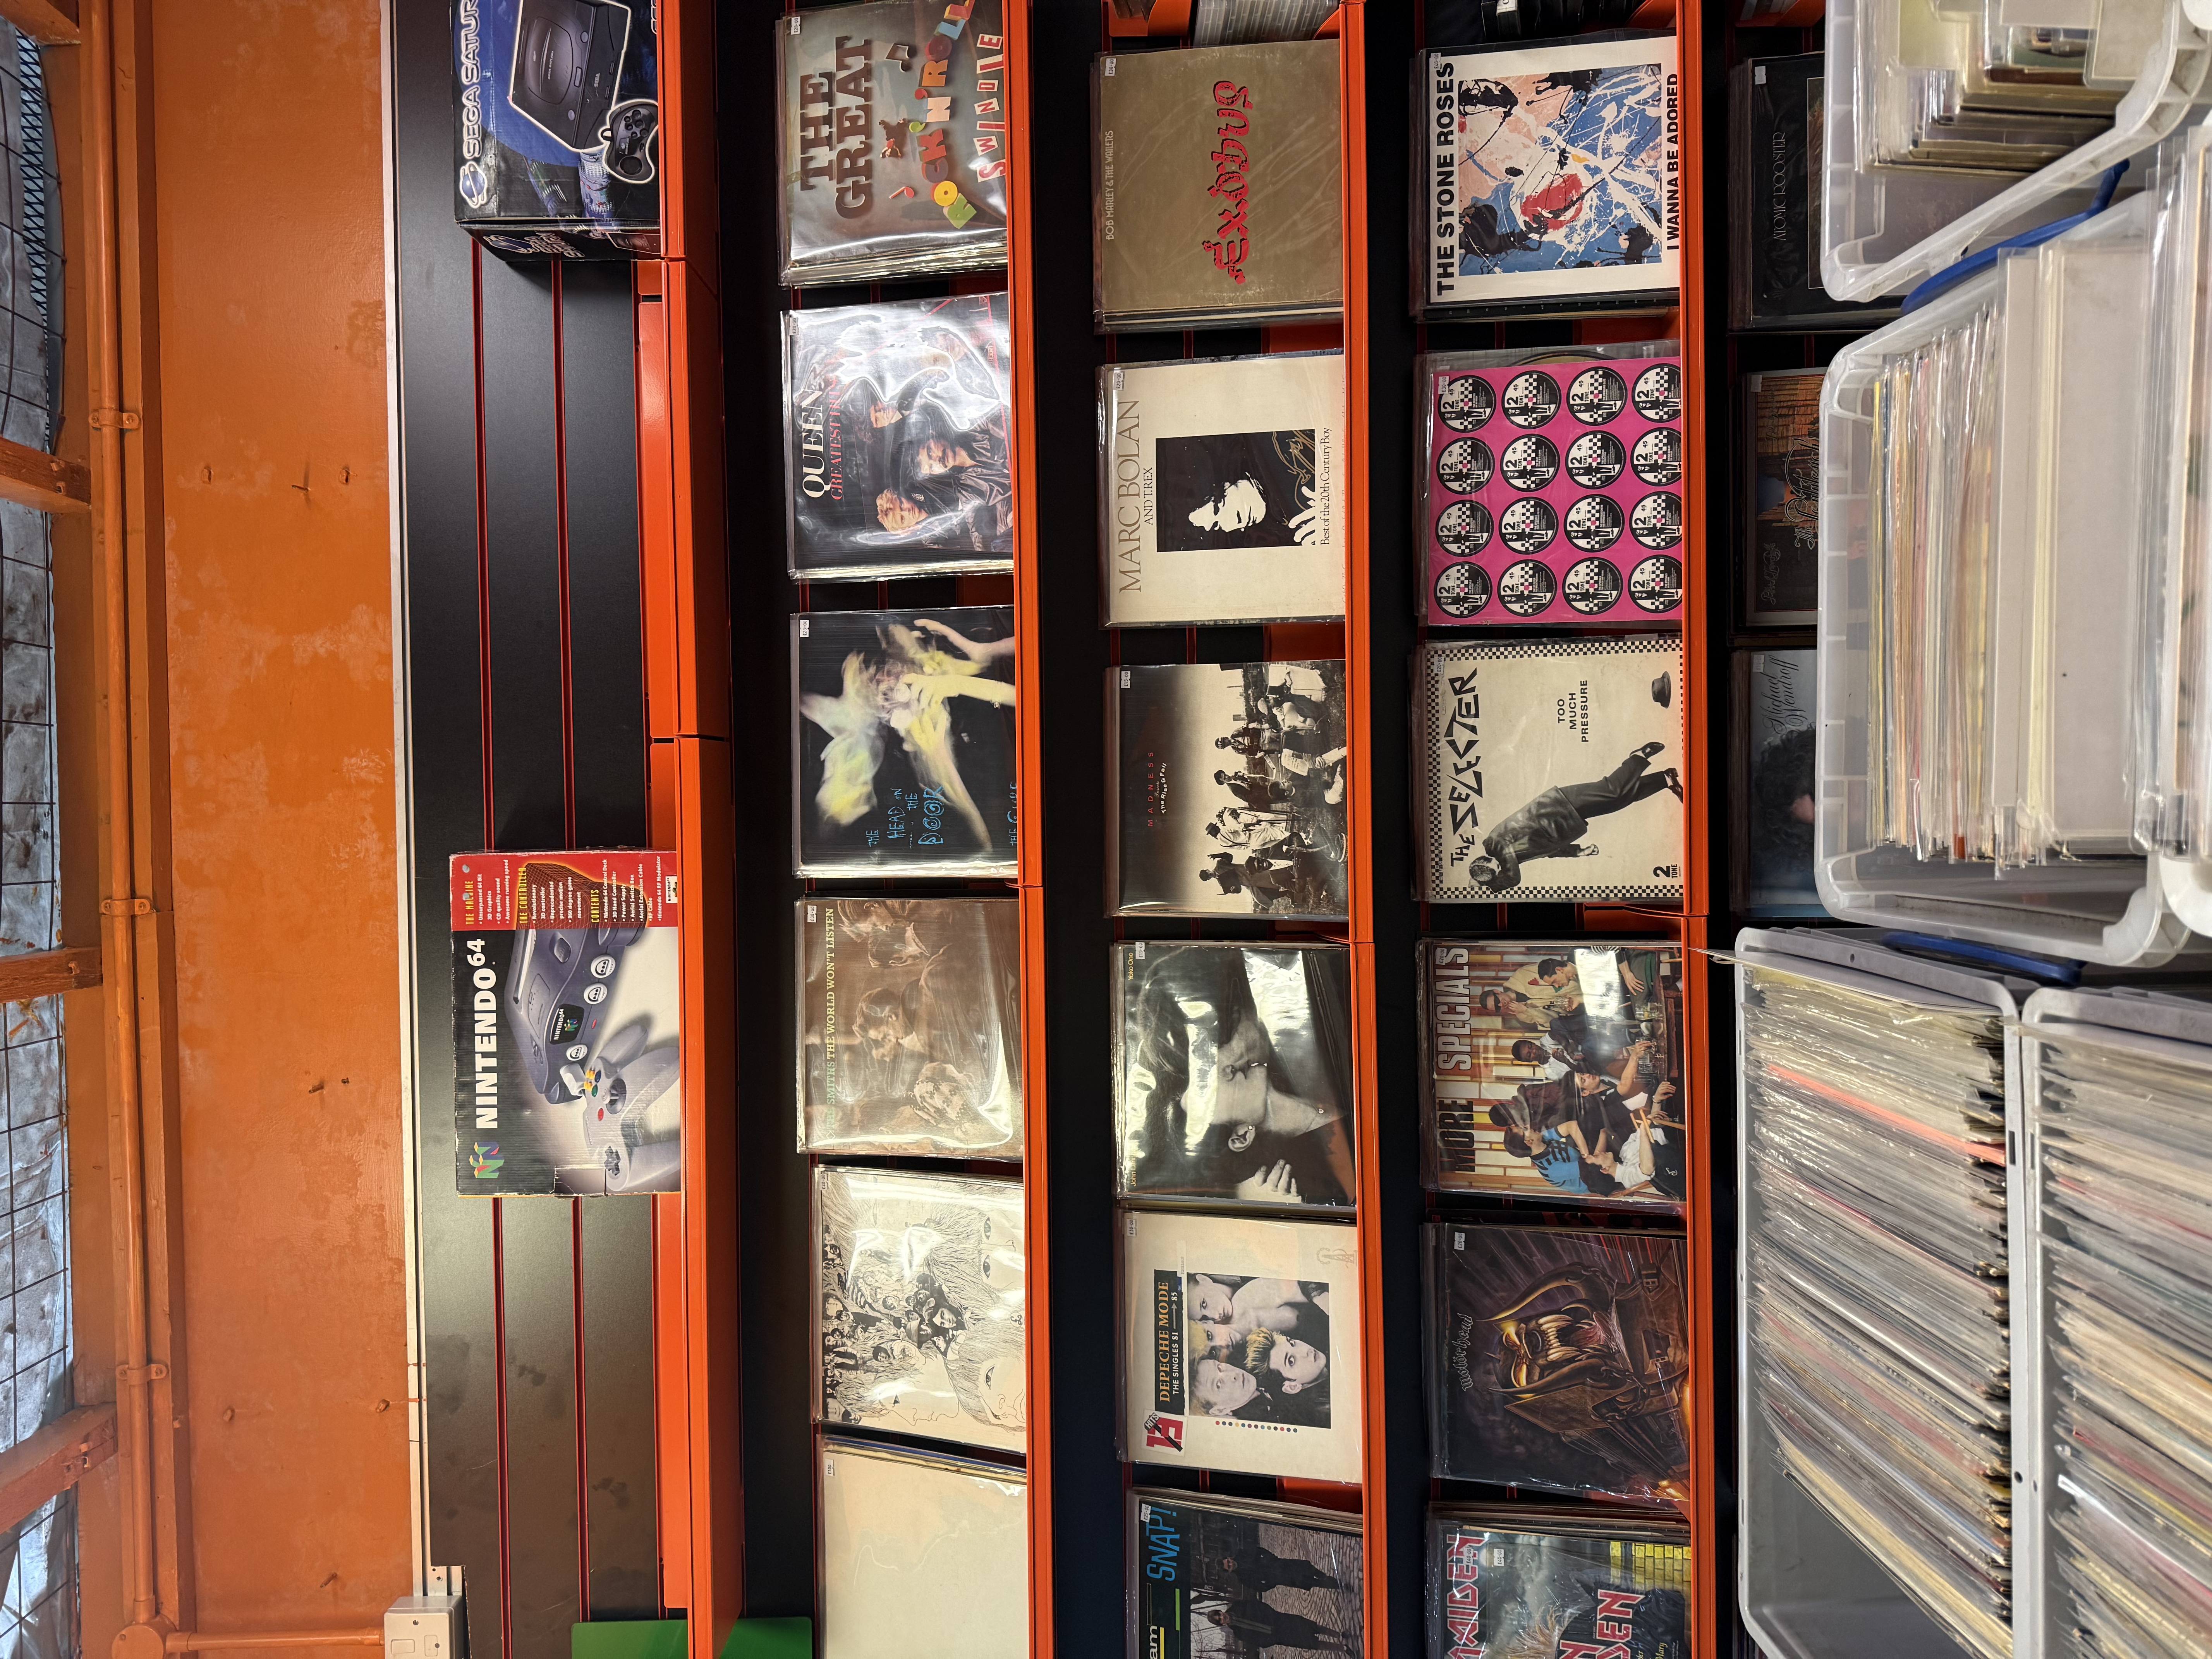
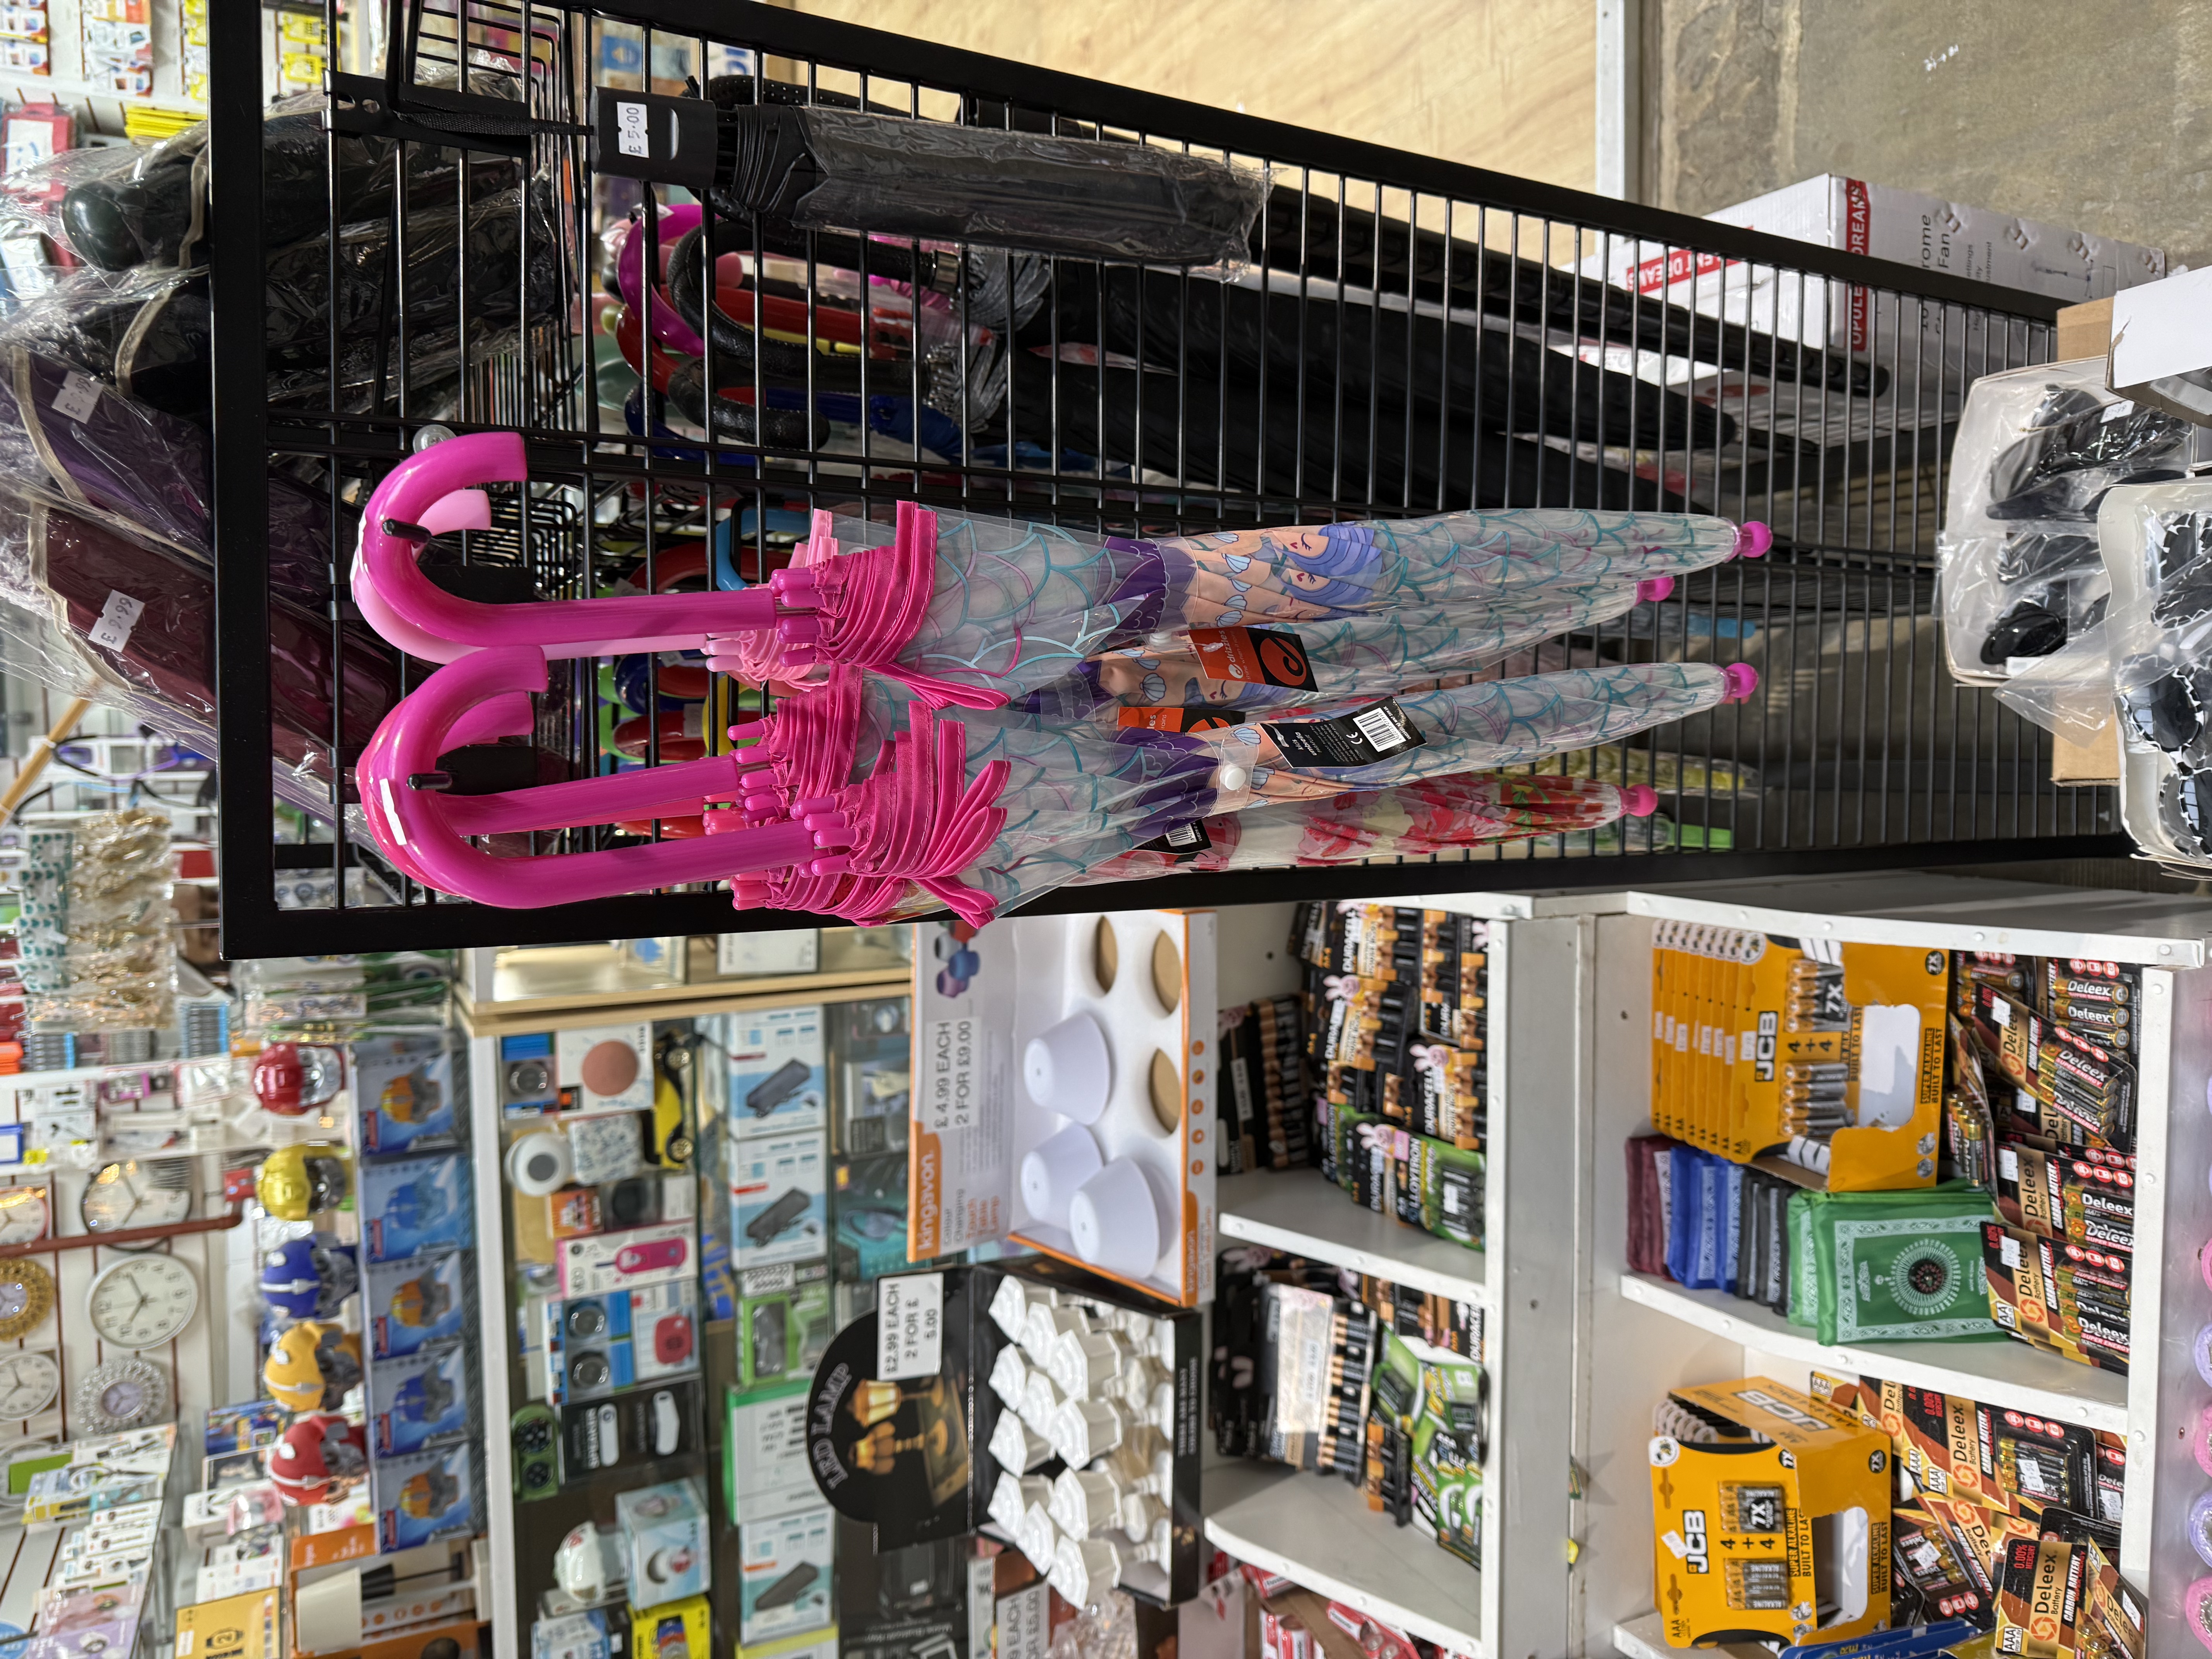
This week, we visited the very distinctive and highly crowded Kirkgate Market. This market does have an abundance of goods, including a wide range of food, beverages, entertainment, as well as various services such as beauty and hair care. The missing element might be the limited variety of clothing. However, if one wants to increase the variety and brands of clothing, significant changes will be required in the market environment and the hardware infrastructure. As for food, I feel that it comes from all over the world. There are those picked directly from farms, those from farms, and those caught from the ocean. In terms of crops, they should be grown and harvested by farmers, and then transported to factories for packaging. The packaging contains information such as the production date, shelf life and ingredients. In terms of raw materials, for example, wool, before it becomes clothes on the market, it may come from grasslands or pastures. It is a completely natural product. It is collected by herders, cleaned and woven by workers, designed by designers, produced in factories, and finally presented on the market. In terms of experience, I smelled many wonderful scents in the market, of course there were also some foul smells. And I saw many delicious foods, Asian cuisine and European cuisine. At that time, I really wanted to eat. Of course, if I was in a hungry state, I would definitely eat a lot. In terms of technology, using mobile phone photography and taking pictures, it can more intuitively record some beautiful scenes. On that day, I also took many colorful photos and videos.
Image:


Week 9 Reflection
In the ninth week's Workshop, through the Arduino LoveoMeter experiment, I was for the first time exposed to the specific operation mode of body and perception technologies in digital media by "building by hand". Different from previous tasks that mainly focused on platform data and algorithmic inference, this practice regarded the body as a measurable and programmable data source. The combination of sensors, LEDs, and serial output clearly demonstrated how body states could be converted into digital signals, thus becoming objects that computational systems could handle. Although this task seemed technically simple, the various uncertainties during the experiment, such as whether the sensor readings were accurate, whether the wiring was normal, and whether the data was successfully displayed, made me realize that the seemingly smooth perception technology behind commercial platforms is actually built on a highly fragile and contingent material environment. During the process of setting up and adjusting LoveoMeter, I gained a more intuitive understanding of some characteristics of perception technology. The reference values, threshold settings, and classification logic in the Arduino code illustrate that "body data" is not naturally present but is constructed through technological choices. Just by slightly adjusting the reference temperature, a person's "heat level" will be interpreted completely differently. This made me realize that the body data we often think of as objective is actually influenced by the standards of the designer, the sensitivity of the equipment, and the classification method of the algorithm. This aligns with the critical viewpoint in digital cultural studies: perception technology does not simply record the body, but is constantly "producing" a body that can be calculated and managed. What most inspired me was that this task changed my understanding of "agency" in the human-machine relationship. On commercial platforms, sensing technologies are often completely hidden. By physically building circuits and sensor devices, I had to confront the actual working methods of these systems and why they malfunctioned. When the circuits were unstable and the readings fluctuated frequently, these "failures" clearly exposed the assumptions and limitations behind the technology, as well as the human labor required to maintain the operation of digital systems. Creative hacking made me realize that digital technology is not an immutable black box, but a social technological combination that can be modified, questioned, and redesigned. This perspective made the reflection on the relationship between the body, data, and algorithms more concrete, and also made me more aware of how technology participates in shaping our understanding of ourselves and the world.